External Apps Tutorials
Return to K20’s Desmos Home Page
Desmos Studio: Graphing Calculator
Overview
From graphing functions to plotting tables of data to creating sliders to allow exploration of transformations, the Desmos Studio graphing calculator is a great free resource for both students and teachers.
Before using the graphing calculator tool with students, take some time to try it out yourself. Being familiar with the graphing calculator can help you to better support students and answer their questions.
How to Use
Go to Desmos.com. Select “Graphing Calculator.”
- Add Items. Add expressions, functions, notes, tables, images, ordered pairs, etc. using the input column on the left or the “Add Item” (plus sign) button.
- Add Special Characters or Functions. Use the “Show Keypad” button to quickly add special functions or symbols. Keep in mind that options from the keypad are also available via keyboard shortcuts. (For example, press the less than (<) key immediately followed by an equal sign (=) to yield a less than or equal symbol (≤).
- Adjust Graph Setting. Change the display size, view window, etc. by clicking the “Graph Settings” (wrench icon) button.
Here’s an interactive tutorial.
** Best experienced in Full Screen (click the icon in the top right corner before you begin) **
Select the Start button, then select the arrows to move through the Graphing Calculator screens. Use the magnifying glass to Zoom in or out.
Extra Resources
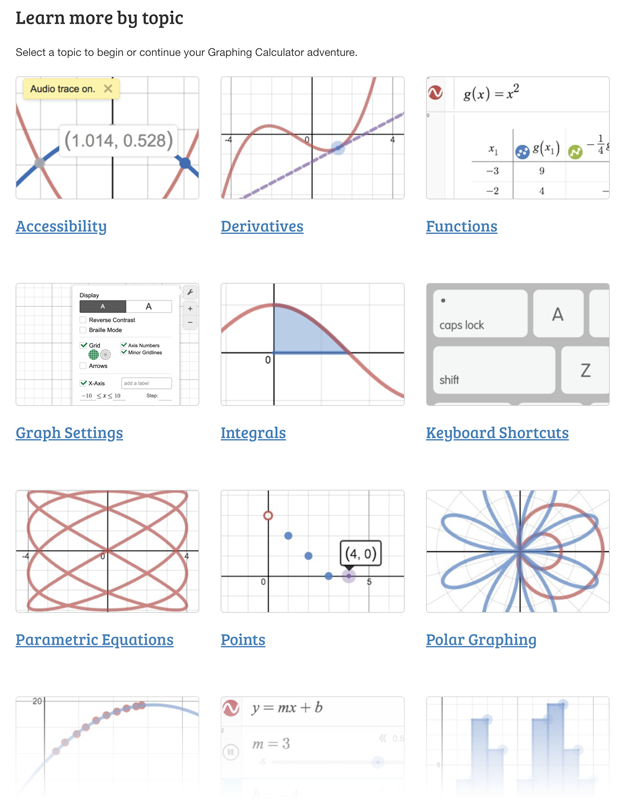
The Getting Started: Desmos Graphing Calculator resource is a convenient way to learn more about a specific topic. The Desmos User Guide is also a great resource, especially for getting started.


